Beware the Rolling Average
With four paremeters I can fit an elephant, and with five I can make him wiggle his trunk.
– John von Neumann
In my last blog post, I erroneously used linear correlation on a rolling average. I’ll quickly show why this is invalid.
import pandas as pd
import numpy as np
import matplotlib.pyplot as plt
import scipy.stats as stats

N = 15000 # to match the data from the last blog post

x = pd.Series(np.arange(N))                 # uniform range
y = pd.Series(np.random.randint(0, 101, N)) # generate 15000 integers in the range [0..100]
Let’s validate that this data is completely random.
plt.scatter(x, y)
plt.title('Random Data')
plt.show()
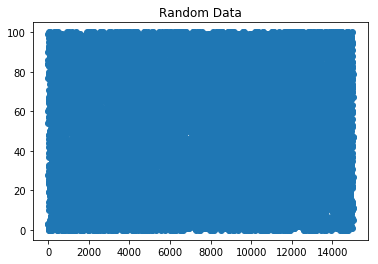
It is fairly obvious that there is not a pattern here. This matches our intuition: each $y$ value was generated independently of $x$, so we should expect no relationship.
r, p = stats.pearsonr(x, y)
print('r:', r)
print('p-value:', p)
r: 0.012106010009553197
p-value: 0.13817855591138736
Our p-value is way above any standard critical value (e.g. $\alpha = 0.05$). Thus, we would fail to reject $H_0: r = 0$. In other words, we really shouldn’t try to perform a linear regression on the data.
However, we will see that rolling averages muddle this result.
window = 365

x2 = x[window - 1:] # drop the first window elements
y2 = y.rolling(window).mean().dropna()

slope, intercept, r, p, std_err = stats.linregress(x2, y2)
print('r:', r)
print('p-value:', p)
r: 0.24565395994812536
p-value: 4.320422059950385e-200
Our p-value has substantially decreased, so we may be mistaken into rejecting $H_0$, or into believing there is some linear correlation here.
abline_values = [slope * x + intercept for x in x2]

plt.plot(x2, y2, label='{}-value Rolling Average'.format(window))
plt.plot(x2, abline_values, label='Linear Regression')

plt.legend()
plt.title('Random Data with Rolling Mean')
plt.show()
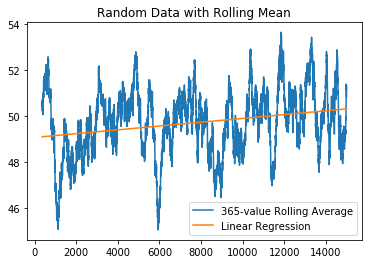
Wait a minute, this data was completely random before! Even though it still looks random, it looks far more organized than it really was. What happens if we exaggerate the window?
window = 2000

x3 = x[window - 1:] # drop the first window elements
y3 = y.rolling(window).mean().dropna()

slope, intercept, r, p, std_err = stats.linregress(x3, y3)
print('r:', r)
print('p-value:', p)

abline_values = [slope * x + intercept for x in x3]

plt.plot(x3, y3, label='{}-value Rolling Average'.format(window))
plt.plot(x3, abline_values, label='Linear Regression')
plt.legend()

plt.title('Random Data with Rolling Mean')
plt.show()
r: 0.6015237023859201
p-value: 0.0
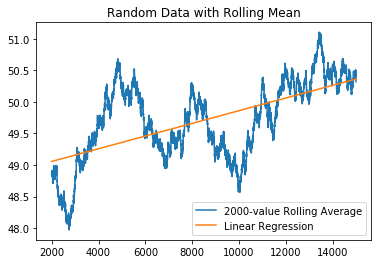
So, $r$ has increased, and our p-value has decreased… we’re seeing patterns that aren’t there. Let’s try to generalize this result.
df = pd.DataFrame(columns=['r', 'p-value'], index=range(1, 5001))

for window in range(1, 5000):
    xw = x[window - 1:]
    yw = y.rolling(window).mean().dropna()

    r, p = stats.pearsonr(xw, yw)

    df.iloc[window, 0] = r
    df.iloc[window, 1] = p
plt.plot(df['r'], label='r')
plt.plot(df['p-value'], label='p-value')
plt.title('Linear Correlation Statistics vs. Rolling Average. Window Size')
plt.legend()
plt.show()
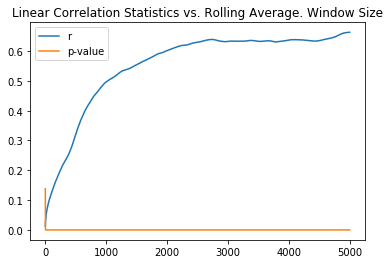
Using a rolling average with a large window, we can be tricked into believing we have a reasonable linear correlation. This is the risk with statistics. Humans are distinctly good at recognizing patterns among noise. Unfortunately, we’re also good at hallucinating patterns when only noise is present.
This issue, on a more general level, is called overfitting, and, as we move more towards a data driven society, its effects are exacerbated. Linear regression is just about the simplest model that one can create for some data. As such, it is relatively easy to catch any errors in usage (though one slipped right by me, a relative layman in the field). That also limits its power, however.
To tackle the problems of big data, it is often necessary to use models of staggering complexity, like neural networks. One of the big issues with a neural network is that it gives no explanation for its answers, beyond a dense matrix of neuron weights. I would argue that because we do not have the tools to understand why these models give us the answers that they do, we are unable to responsibly act on their outputs. I believe that the problems that arise from misusing models can be just as bad as the problems they are meant to solve, and I forsee catastrophe arising from our haste.
That’s enough doomsday prophecies for a day. Personally, I’ll be brushing up on my statistics knowledge so I can prevent myself from making mistakes in the future.